Cosmic Structures

Sloan Digital Sky Survey / (2/5)

To improve the visualization of the filamentary structure, an area of about 10 degrees is presented in this map. This means that only a thin slice of the SDSS data is shown here in contrast to the previous map where a random set of 500000 galaxies and quasars, distributed over the entire survey, was selected.

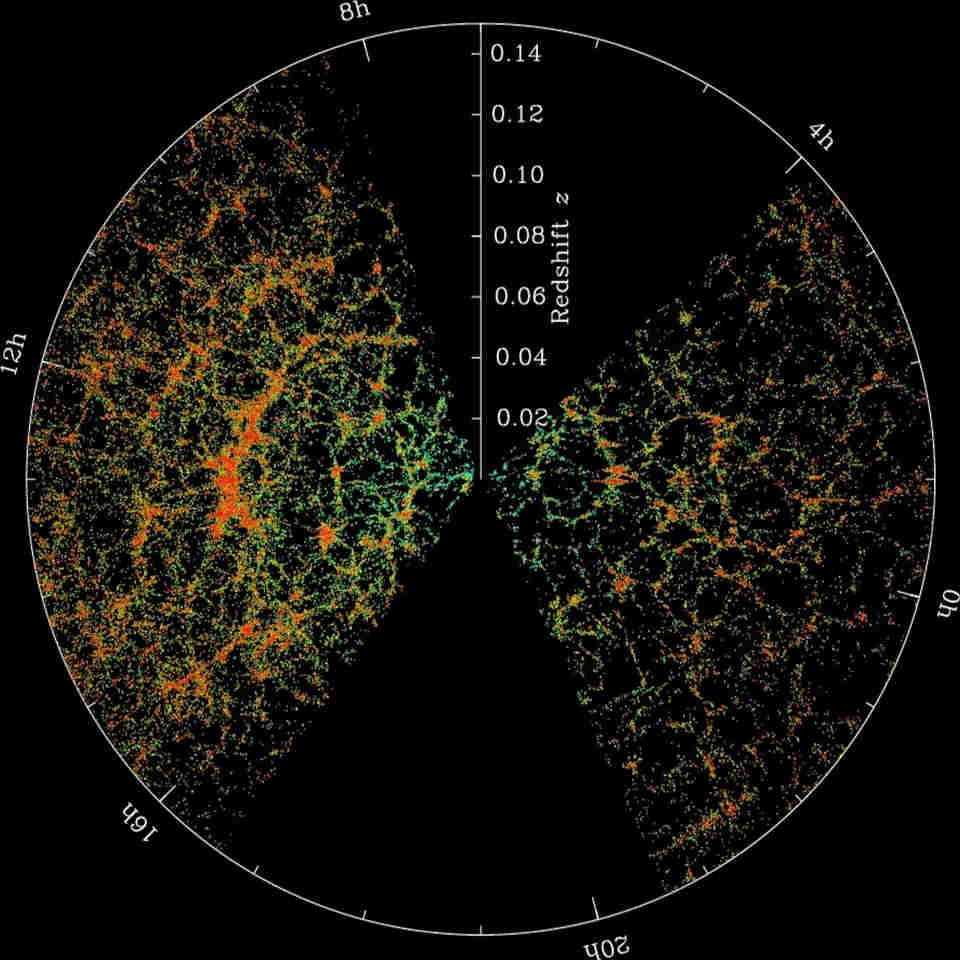
The observations of the galaxies are more extensive and more precise when the objects are closer to the earth. Up to a redshift value of z = 1.5, which equals to a depth of around 2 billion light years, the cosmic structures are clearly visible.

One of the most spectacular structures in the Northern Galactic Hemisphere is the Sloan Great Wall, located approximately one billion light years away from earth. The structure was discovered in 2003 by J. Richard Gott and colleagues at Princeton University, New Jersey, United States. The Analysis of the Great Wall revealed a huge string of galaxies of about 1.37 billion light years in length, which is approximately 1/60 of the diameter of the observable universe. The bright orange region in the image above shows the position of the wall which can also be explored in the animation.

SDSS Data Release 16

Galaxies: 2963274
Quasars: 1102641
Sky Coverage: 14555 deg2
Median Redshift: 0.73391
equates to ~ 10 billion LYs
Survey: 1998-2019
Published: 09.12.2019

Credit: SDSS

Billions of galaxies

Telescopes are observing millions of new galaxies every year and the idea of what the universe looks like is constantly evolving. Several deep sky surveys show us, that the space is filled with billions of galaxies forming a global filamentary structure. This website visualizes such cosmic structures in 3D where you can rotate, pan and zoom the map. The animations are based on real data derived from the largest spectroscopic sky surveys ever made: SDSS, 6dFGS, 2dFGRS and DESI.

Astronomical data

The amount of astronomical data is growing rapidly. For example, within the SDSS project the positions and brightnesses of almost 500 million celestial objects were measured. To reduce the amount of data and speed up the loading time in this project not all of these objects are shown. In such cases the objects were selected randomly.

Animation

You may wonder why the galaxies are displayed as little squares instead of dots, circles or even images of the observed galaxies. The reason for this is again to speed up the animation and to shorten running– and loading–times. The colors of the squares ranging from light turquoise over blue to red, yellow and green indicate the distances of the galaxies from earth.

Navigation and Control

Click the buttons on the right to start and stop the automatic rotation, to open and close info boxes, to change between the various surveys and to open this introduction. The animation can be accompanied by music using the audio player at the bottom of the page.

 Start and stop rotation.

¡  Open and close info boxes.

1 - 5  Change between different surveys.

?  Open this introduction.

Use finger gestures on touch screens or the mouse for control.

. Left mouse button: Rotate map.
. Right mouse button: Pan map.
. Mousewheel: Zoom in and out.

Contact


Hans Braxmeier, Feb. 2023
00000