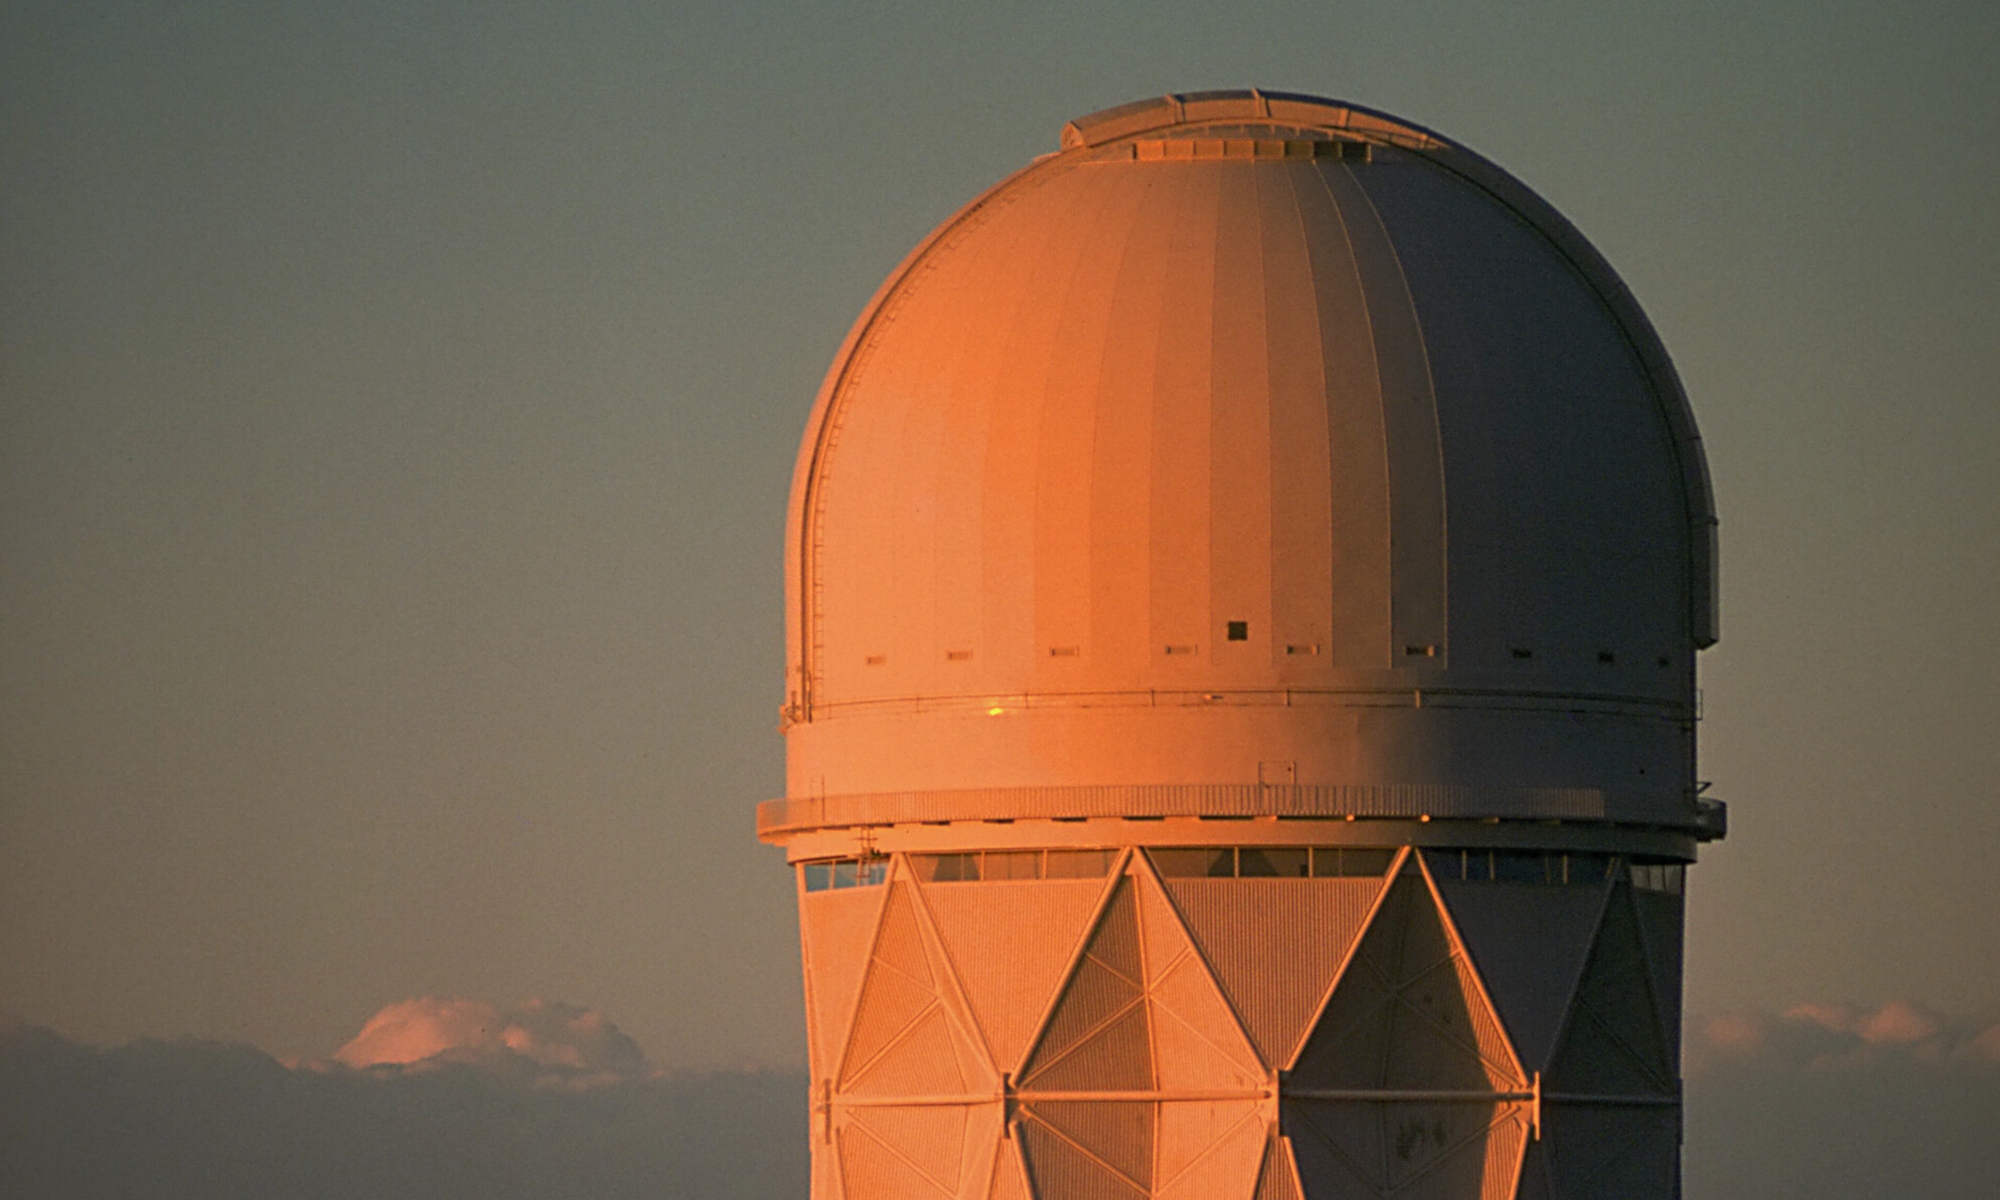
The Dark Energy Spectroscopic Instrument (DESI) is a scientific research instrument for conducting spectrographic astronomical surveys of distant galaxies. It is mounted on the Mayall 4-meter telescope at Kitt Peak National Observatory near Tucson, Arizona, United States.
DESI is the latest and most comprehensive project to explore and test cosmological models. Until it's completion – expected in 2026 – the survey will cover more than 1/3 of the sky and observe over 40 million galaxies up to a redshift of 3.5.
This map is based on the DESI Data Release 9 completed by other spectroscopic redshifts and illustrates the unimaginable size of the universe once again.
The animation shows 1.5 million single objects randomly selected from the DESI survey containing 3743229 cosmic objects. Due to the large amount of data and the depth of the observation, the cosmic filaments and voids appear more clearly at greater distances.
DESI Data Release 9
Cosmic objects: 3743229 Sky Coverage: 14000 deg2 Median Redshift: 0.39922 equates to ~ 5.4 billion LYs Survey: 2013–2019 Published: 07.03.2019
Telescopes are observing millions of new galaxies every year and the idea of what the universe looks like is constantly evolving. Several deep sky surveys show us, that the space is filled with billions of galaxies forming a global filamentary structure. This website visualizes such cosmic structures in 3D where you can rotate, pan and zoom the map. The animations are based on real data derived from the largest spectroscopic sky surveys ever made: SDSS, 6dFGS, 2dFGRS and DESI.
Astronomical data
The amount of astronomical data is growing rapidly. For example, within the SDSS project the positions and brightnesses of almost 500 million celestial objects were measured. To reduce the amount of data and speed up the loading time in this project not all of these objects are shown. In such cases the objects were selected randomly.
Animation
You may wonder why the galaxies are displayed as little squares instead of dots, circles or even images of the observed galaxies. The reason for this is again to speed up the animation and to shorten running– and loading–times. The colors of the squares ranging from light turquoise over blue to red, yellow and green indicate the distances of the galaxies from earth.
Related
The gigantic Virgo Supercluster includes the Local Group with our galaxy, the Milky Way, and our nearest large galaxy, Andromeda. The center of this supercluster is called Virgo Galaxy Cluster, which can be observed from Earth with extremely high sensitivity and in great detail.
Navigation and Control
Click the buttons on the right to start and stop the automatic rotation, to open and close info boxes, to change between the various surveys and to open this introduction. The animation can be accompanied by music using the audio player at the bottom of the page.
◾ Start and stop rotation.
¡ Open and close info boxes.
1 - 5 Change between different surveys.
? Open this introduction.
Use finger gestures on touch screens or the mouse for control.
. Left mouse button: Rotate map. . Right mouse button: Pan map. . Mousewheel: Zoom in and out.