Cosmic Structures

Sloan Digital Sky Survey / (1/5)

The Sloan Digital Sky Survey (SDSS) is a major multi–spectral imaging and spectroscopic redshift survey using a 2.5 m wide–angle optical telescope at Apache Point Observatory in south–east New Mexico, United States.
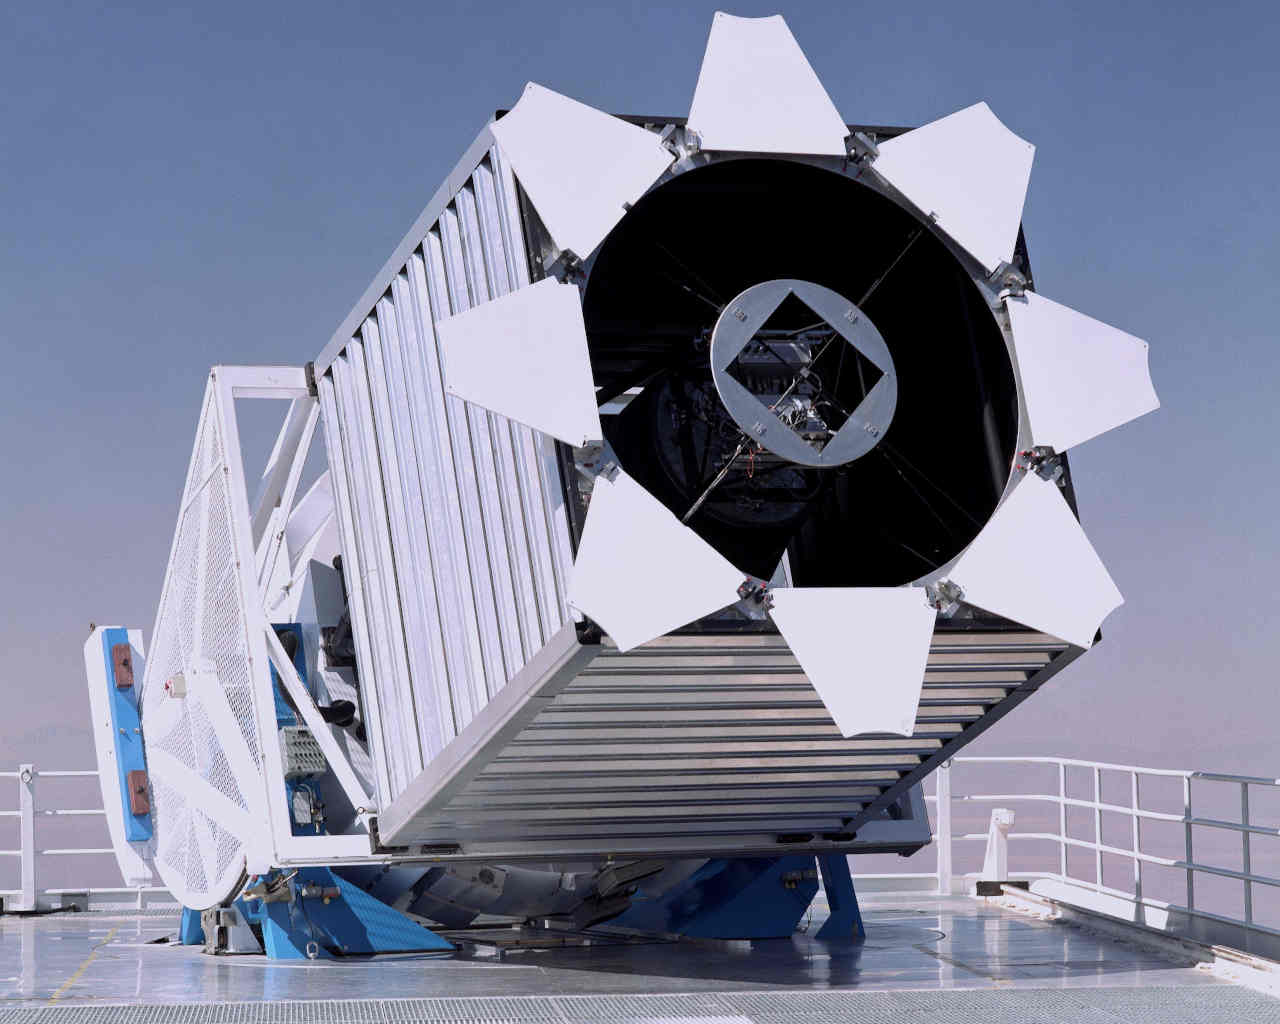
After mapping more than one-third of the entire celestial sphere the telescope has observed millions of stars, galaxies and quasars since 1998.

In this map – based on SDSS Data Release 16 – every single square represents a galaxy or a quasar with millions and millions of stars which may be surrounded by planets like the earth. The earth is located in the center of the map from where the observations are made.

The Milky Way splits the observable area into two parts filled with billions of galaxies. The parts, separated by the galactic plane, are referred to as the Northern Galactic Hemisphere (NGH) and the Southern Galactic Hemisphere (SGH). In the dark areas objects are obscured by the Milky Way. Thus lie hidden behind myriads of stars and huge clouds of gas and dust and therefore can not be observed.

The animation shows a random set of 500000 galaxies and quasars with a depth of almost 13 billion light years building clusters as well as large voids. Those filaments present the structure of the universe – the so called cosmic web – where our galaxy, the Milky Way, is only a tiny dot.

Credit: SDSS

Billions of galaxies

Telescopes are observing millions of new galaxies every year and the idea of what the universe looks like is constantly evolving. Several deep sky surveys show us, that the space is filled with billions of galaxies forming a global filamentary structure. This website visualizes such cosmic structures in 3D where you can rotate, pan and zoom the map. The animations are based on real data derived from the largest spectroscopic sky surveys ever made: SDSS, 6dFGS, 2dFGRS and DESI.

Astronomical data

The amount of astronomical data is growing rapidly. For example, within the SDSS project the positions and brightnesses of almost 500 million celestial objects were measured. To reduce the amount of data and speed up the loading time in this project not all of these objects are shown. In such cases the objects were selected randomly.

Animation

You may wonder why the galaxies are displayed as little squares instead of dots, circles or even images of the observed galaxies. The reason for this is again to speed up the animation and to shorten running– and loading–times. The colors of the squares ranging from light turquoise over blue to red, yellow and green indicate the distances of the galaxies from earth.

Navigation and Control

Click the buttons on the right to start and stop the automatic rotation, to open and close info boxes, to change between the various surveys and to open this introduction. The animation can be accompanied by music using the audio player at the bottom of the page.

 Start and stop rotation.

¡  Open and close info boxes.

1 - 5  Change between different surveys.

?  Open this introduction.

Use finger gestures on touch screens or the mouse for control.

. Left mouse button: Rotate map.
. Right mouse button: Pan map.
. Mousewheel: Zoom in and out.

Contact


Hans Braxmeier, Feb. 2023
00000